 Alihan Çabuk
OpenEDR



We at OpenEDR believe in creating a cybersecurity platform with its source code openly available to the public, where products and services can be provisioned and managed together. EDR is our starting point. OpenEDR is a full-blown EDR capability. It is one of the most sophisticated, effective EDR code base in the world and with the community’s help, it will become even better.
OpenEDR is free and its source code is open to the public. OpenEDR allows you to analyze what’s happening across your entire environment at the base-security-event level. This granularity enables accurate root-causes analysis needed for faster and more effective remediation. Proven to be the best way to convey this type of information, process hierarchy tracking provides more than just data, they offer actionable knowledge. It collects all the details on endpoints, hashes, and base and advanced events. You get detailed file and device trajectory information and can navigate single events to uncover a larger issue that may be compromising your system.
OpenEDR’s security architecture simplifies breach detection, protection, and visibility by working for all threat vectors without requiring any other agent or solution. The agent records all telemetry information locally and then will send the data to locally hosted or cloud-hosted ElasticSearch deployments. Real-time visibility and continuous analysis are vital elements of the entire endpoint security concept. OpenEDR enables you to perform analysis into what's happening across your environment at base event level granularity. This allows accurate root cause analysis leading to better remediation of your compromises. Integrated Security Architecture of OpenEDR delivers Full Attack Vector Visibility including MITRE Framework.
Quick Start
The community response to OpenEDR has been absolutely amazing! Thank you. We had a lot of requests from people who want to deploy and use OpenEDR easily and quickly. We have a roadmap to achieve all these. However in the meanwhile, we have decided to use the Comodo Dragon Enterprise platform with OpenEDR to achieve that. By simply opening an account, you will be able to use OpenEDR. No custom installation, no log forwarding configuration, or worrying about storing telemetry data. All of that is handled by the Comodo Dragon Platform. This is only a short-term solution until all the easy-to-use packages for OpenEDR is finalized. In the meanwhile do take advantage of this by emailing quick-start@openedr.com to get you up and running!
Components
The Open EDR consists of the following components:
- Runtime components
- Core Library – the basic framework;
- Service – service application;
- Process Monitor – components for per-process monitoring;
- Injected DLL – the library which is injected into different processes and hooks API calls;
- Loader for Injected DLL – the driver component which loads injected DLL into each new process
- Controller for Injected DLL – service component for interaction with Injected DLL;
- System Monitor – the genetic container for different kernel-mode components;
- File-system mini-filter – the kernel component that hooks I/O requests file system;
- Low-level process monitoring component – monitors processes creation/deletion using system callbacks
- Low-level registry monitoring component – monitors registry access using system callbacks
- Self-protection provider – prevents EDR components and configuration from unauthorized changes
- Network monitor – network filter for monitoring the network activity;
- Installer
Generic high-level interaction diagram for runtime components
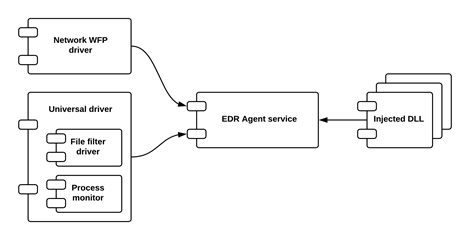 For details, you can refer here: https://techtalk.comodo.com/2020/09/19/open-edr-components/
Community
- Community Forums: https://community.openedr.com/
- Join Slack
- Registration
Build Instructions
You should have Microsoft Visual Studio to build the code
- Open Microsoft Visual Studio 2019 as Administrator under /openedr/edrav2/build/vs2019/
- Open the edrav2.sln solutions file within the folder
- Build Release on edrav2.sln on Visual Studio
- Open Microsoft Visual Studio 2019 as Administrator under /openedr/edrav2/iprj/installations/build/vs2019/
- Open installation.wixproj
- Compile installer.
needs checking
## Libraries Used:
* AWS SDK AWS SDK for C++ : (https://aws.amazon.com/sdk-for-cpp/)
* Boost C++ Libraries (http://www.boost.org/)
* c-ares: asynchronous resolver library (https://github.com/c-ares/c-ares)
* Catch2: a unit testing framework for C++ (https://github.com/catchorg/Catch2)
* Clare : Command Line parcer for C++ (https://github.com/catchorg/Clara)
* Cli: cross-platform header-only C++14 library for interactive command line interfaces (https://cli.github.com/)
* Crashpad: crash-reporting system (https://chromium.googlesource.com/crashpad/crashpad/+/master/README.md)
* Curl: command-line tool for transferring data specified with URL syntax (https://curl.haxx.se/)
* Detours: for monitoring and instrumenting API calls on Windows. (https://github.com/microsoft/Detours)
* Google APIs: Google APIs (https://github.com/googleapis/googleapis)
* JsonCpp: C++ library that allows manipulating JSON values (https://github.com/open-source-parsers/jsoncpp)
* libjson-rpc-cpp: cross platform JSON-RPC (remote procedure call) support for C++  (https://github.com/cinemast/libjson-rpc-cpp)
* libmicrohttpd : C library that provides a compact API and implementation of an HTTP 1.1 web server (https://www.gnu.org/software/libmicrohttpd/)
* log4cplus: C++17 logging API (https://github.com/log4cplus/log4cplus)
* MadcHook, MadcHookDrv : Hooking http://madshi.net/
* NetFilter SDK & ProtocolFilter: Network filtering toolkit (https://netfiltersdk.com/)
* nlohmann JSON: JSON library for C++: (https://github.com/nlohmann/json)
* OpenSSL Toolkit (http://www.openssl.org/)
* Tiny AES in C: implementation of the AES ECB, CTR and CBC encryption algorithms written in C. (https://github.com/kokke/tiny-AES-c)
* Uri: C++ Network URI (http://www.boost.org/)
* UTF8-CPP: UTF-8 with C++ (http://utfcpp.sourceforge.net/)
* xxhash_cpp: xxHash library to C++17. (https://cyan4973.github.io/xxHash/)
* Zlib: Compression Libraries (https://zlib.net/)
* WixToolset: Installer Libraries (https://wixtoolset.org/releases/)
Roadmap
Please refer here for project roadmap : https://github.com/ComodoSecurity/openedr_roadmap/projects/1
Roadmap
Please refer here for project roadmap : https://github.com/ComodoSecurity/openedr_roadmap/projects/1
Installation Instructions
OpenEDR is a single agent that can be installed on Windows endpoints. It generates extensible telemetry data for overall security-relevant events. It also uses file lookup, analysis, and verdict systems from Comodo, https://valkyrie.comodo.com/. You can also have your own account and free license there.
The telemetry data is stored locally on the endpoint itself. You can use any log streaming solution and analysis platform. Here we will present, how can you do remote streaming and analysis via open source tools like Elasticsearch ELK and Filebeat.
OpenEDR:
OpenEDR project will release installer MSI’s signed by Comodo Security Solutions, The default installation folder is C:\Program Files\OpenEdr\EdrAgentV2
The agent outputs to C:\ProgramData\edrsvc\log\output_events by default, there you will see the EDR telemetry data where you should point this to Filebeat or other log streaming solutions you want. Please check following sections for details
Docker and Docker Compose:
Docker is widely known virtualizon method for almost all environments you can use use docker for installing Elasticsearch and Log-stash to parse and more visibiltiy we used Docker to virtualize and make an easy setup process for monitoring our openedr agent. You can visit and look for more details and configure from https://github.com/docker
Logstash:
Logstash is an open-source data ingestion tool that allows you to collect data from a variety of sources, transform it, and send it to your desired destination. With pre-built filters and support for over 200 plugins, Logstash allows users to easily ingest data regardless of the data source or type. We used Logstash to simplify our output to elasticsearch for more understandable logs and easily accessible by everyone who uses openedr and this example. You may visit and configure your own system as well https://github.com/elastic/logstash
Elasticsearch:
There are multiple options to run Elasticsearch, you can either install and run it on your own machine, on your data center, or use Elasticsearch service on public cloud providers like AWS and GCP. If you want to run Elasticsearch by yourself. You can refer to here for installation instructions on various platforms https://www.elastic.co/guide/en/elasticsearch/reference/current/install-elasticsearch.html
Another option is using Docker, this will also enable a quick start for PoC and later can be extended to be production environment as well. You can access the guide for this setup here: https://www.elastic.co/guide/en/elasticsearch/reference/7.10/docker.html
Filebeat:
Filebeat is a very good option to transfer OpenEDR outputs to Elasticsearch, you need to install Filebeat on each system you want to monitor. Overall instructions for it can be found here: https://www.elastic.co/guide/en/beats/filebeat/current/filebeat-installation-configuration.html
We don’t have OpenEDR Filebeat modules yet so you need to configure a custom input option for filebeat https://www.elastic.co/guide/en/beats/filebeat/current/configuration-filebeat-options.html
Editing Alerting Policies
The agent uses network driver, file driver, and DLL injection to capture events that occur on the endpoint. It enriches the event data with various information, then filters these events according to the policy rules and sends them to the server.
You can customize your policy with your own policy. Within the installation folder which is "C:\Program Files\Comodo\EdrAgentV2" policy file called "evm.local.src"
For Comodo suggested rules please check the rule repo https://github.com/ComodoSecurity/OpenEDRRules
You can edit this file with any text editor and customize your own policy accordingly with the given information below.
{
    "Lists": {
        "List1": ["string1", "string2", ...],
        "List2": ["string1", "string2", ...],
        ...
    },
    "Events": {
        "event_code": [<AdaptiveEvent1>, <AdaptiveEvent2>, ...],  --> The order of the adaptive events in the list is important (see Adaptive Event Ordering).
        "event_code": [<AdaptiveEvent1>, <AdaptiveEvent2>, ...],
        ...
    }
}
Adaptive Event
{
    "BaseEventType": 3
    "EventType": null|GUID,
    "Condition": <Condition>
}
Condition
{
    "Field": "parentVerdict",
    "Operator": "!Equal",
    "Value": 1
}
Boolean operators are supported. The following also is a condition:
Equal",
    "Value": 1
}
Boolean operators are supported. The following is also a condition:

{
    "BooleanOperator": "Or",
    "Conditions": [
        {
            "Field": "parentVerdict",
            "Operator": "!Equal",
            "Value": 1
        },
        {
            "Field": "parentProcessPath",
            "Operator": "MatchInList",
            "Value": "RegWhiteList"
        }
    ]
}
Nesting with Boolean operators are supported. The following is also a condition:

{
    "BooleanOperator": "And",
    "Conditions": [
        {
            "Field": "parentProcessPath",
            "Operator": "!Match",
            "Value": "*\\explorer.exe"
        },
        {
            "BooleanOperator": "Or",
            "Conditions": [
                {
                    "Field": "path",
                    "Operator": "Match",
                    "Value": "*\\powershell.exe"
                },
                {
                    "Field": "path",
                    "Operator": "Match",
                    "Value": "*\\cmd.exe"
                }
            ]
        }
    ]
}
The BooleanOperator field can be one of the following:
and or
The Operator field can be one of the following:
| Operator | Value Type | Output |
|---|---|---|
Equal |
Number, String, Boolean, null | true if the field and the value are equal |
Match |
String (wildcard pattern) | true if the field matches the pattern (environment variables in the pattern must be expanded first) |
MatchInList |
String (list name) | true if the field matches one of the patterns in the list (environment variables in patterns must be expanded first) |
!Equal, !Match and !MatchInList must also be supported.
Adaptive Event Ordering
When an event is captured, the conditions in the adaptive events are checked sequentially. When a matching condition is found, the BaseEventType and EventType in that adaptive event are added to the event data and the event is sent. Other conditions are not checked. No logging will be done if no advanced event conditions match. If the Condition field is not provided, it is assumed that the condition matches.
Example on the go
We used these given technologies for an even simpler solution for example and you can use these methods and configure them for your own need even use different technologies depending on your needs.
> Install docker on the device
> Clone pre-prepared ELK package
> Run docker-compose.yaml with docker-compose
> Install openedr and filebeat on the client device
> Configure filebeat to your elastic search and logstash
All configure and installation documents are can be found within explanation paragraphs for our example you can follow the steps given below
Docker installation
- For Linux distros visit and follow instructions at https://docs.docker.com/desktop/install/linux-install/
- in our example we used Ubuntu-Server 22.04 LTS you may go with that since gnome-terminal which is needed by docker. simply run with the order
 apt-get update
 apt-get upgrade
 apt install docker
use sudo if you don't have root access
Setting up Elasticsearch Kibana and Logstash
-
You can get the pre-configured package at https://github.com/deviantony/docker-elk also, you can configure your system defaults also work but less securely please check https://github.com/deviantony/docker-elk/blob/main/README.md for further information on configuration details
 )
Clone or download the repository
Open Terminal inside repo and run
)
Clone or download the repository
Open Terminal inside repo and run$ sudo docker-compose up -d-d is for running at the background and if permissions are asked please re-run with sudo privileges
 You should be able to see docker containers.
check with
console sudo docker ps keep in mind kibana is the log ui in this setup we gonna use kibanas port later on
by now your monitoring tools are up and running
Reminder default password and user would be
Username : elsatic
Password : changeme
keep in mind kibana is the log ui in this setup we gonna use kibanas port later on
by now your monitoring tools are up and running
Reminder default password and user would be
Username : elsatic
Password : changeme
Setting up Openedr and File beat
-
openedr is a simple msi installer most of the current windows machines are capable you can use the installer and its own instructions.
-
Filebeat is a log analysis tool you can download the installer and follow up on its instructinos https://www.elastic.co/downloads/beats/filebeat
First, you need to enable logstash within Filebeat to do that
Open Powershell as administrator Change directory to within Powershell "C:\Program Files\Elastic\Beats\8.4.1\filebeat" run this command
.\filebeat.exe modules enable logstash --path.config "C:\ProgramData\Elastic\Beats\filebeat" This command will enable logstash feature and choose your configuration path
 -
For filebeat configuration first go to C:\ProgramData\Elastic\Beats\filebeat You can check out the filebeat.example.yaml and edit that for your needs. and now we need to create a file as "filebeat.yaml" inside the directory.
Tip you can copy filebeat.example.yaml and just edit from there Your filebeat.yaml needs these configurations activated and edited for your IP addresses and usage
filebeat.inputs:

-type: filestream

  id: edr

  enabled: true
     paths:

    -C:\ProgramData\edrsvc\log\*


filebeat.config.modules:

  path: ${path.config}/modules.d/*.yml

  reload.enabled: false

setup.template.settings:
  index.number_of_shards: 1

setup.kibana:

    output.logstash:
     hosts: ["Your docker adress:5044"]


- Now we have to configure activated logstash on filebeat go to C:\ProgramData\Elastic\Beats\filebeat\modules.d
You can check out logstash.yaml and edit accourding to your needs and configuration. Edit logstash.yaml as accordingly
module: logstash

  log:
    enabled: true


    var.paths:
     - C:\ProgramData\edrsvc\log\*

  slowlog:
    enabled: false
 as for the final step to run filebeat with these configurations please restart the filebeat service from your services.msc
or run this command from your Powershell as an administrator
as for the final step to run filebeat with these configurations please restart the filebeat service from your services.msc
or run this command from your Powershell as an administrator

Restart-Service -Force filebeat

Setting Up Kibana
Kibana is Uİ based Monitoring system. The logstash and elasticsearch environment can handle most of the logging systems such as openedr
First set up logstash in kibana
Within browse integrations you can find logstash right away
We have already managed Filebeat configurations so you may just scroll down and go to logstash logs
Create data View to see logs and outputs
Check Log stream names and include index patterns like or just as coming indexes
Create a new Dashboard Configure for your requirements with coming filed abd graphs and example of time and log count
You can create more dash boards as you like You can find your metrics with in dashboard

Releases
https://github.com/ComodoSecurity/openedr/releases/tag/2.5.0.0
Screenshots
How OpenEDR integration with a platform looks like and also a showcase for openedr capabilities
Detection / Alerting

Event Details

Dashboard

Process Timeline

Process Treeview

Event Search
