17 KiB
Usage
This section provides some guidance on how to use Mole.
Configuration
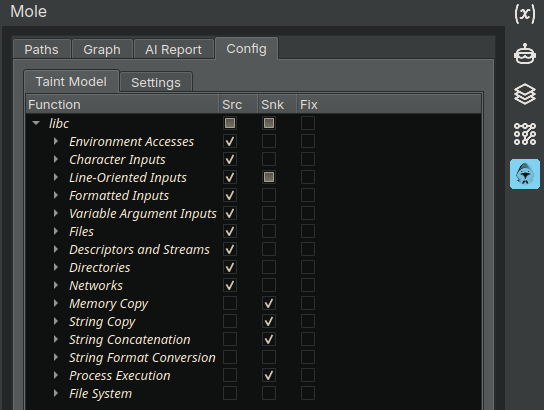
Mole is implemented as a Binary Ninja sidebar plugin and provides a dedicated Config tab that centralizes all configuration options. Within this tab, the Taint Model sub-tab allows users to manage taint-propagating functions, while general plugin settings can be configured in the Settings sub-tab.
Taint Model
The taint model defines a set of functions, each of which can be assigned one or more roles describing how it interacts with tainted data. The following roles are currently supported:
| Role | Description |
|---|---|
| Source | Function introducing tainted data |
| Sink | Function exposing tainted data |
| Fixer | Modifies a function's type signature to ensure correct taint propagation |
Fixers can be used for functions whose type signatures are incorrectly inferred by Binary Ninja, such as cases where the number or types of arguments are wrong. When enabled, a function's type signature is corrected by parsing its synopsis prior to slicing. Accurate type signatures are essential, as they ensure that taint is correctly propagated through these functions.
The taint model, and the corresponding functions, is backed by JSON files located in the conf/ directory. The table below lists the purpose of each file:
| File | Description / Purpose |
|---|---|
conf/000-mole.json |
File storing the effective configuration of Mole |
conf/001-settings.json |
Default values for general Mole settings |
conf/002-manual.json |
Default values for Mole's manually added functions |
conf/003-libc.json |
Configuration file for common libc functions |
conf/004-yourlib.json |
Example configuration file for user-defined functions |
You can add your own functions either by creating a custom JSON file (e.g., conf/004-yourlib.json) or by adding them manually through Binary Ninja's UI. For more details on how to do this and the expected format, refer to the next subsections.
Configure Functions via JSON Files
To define your own functions - such as those belonging to a custom third-party library - you can use conf/003-libc.json as a template. First, duplicate and rename this file (e.g., to conf/004-yourlib.json), then add your custom function definitions to it. The expected format is described below and can be validated using the JSON schema at conf/taint_model_schema.json:
{
  "taint_model": {                                        // Taint model
    "libc": {                                             // Library
      "Process Execution": {                              // Category
        "system": {                                       // Function
          "aliases": ["_system", "__builtin_system"],     // Function aliases
          "synopsis": "int system (const char *command)", // Function type signature
          "roles": {                                      // Function roles
            "source": {                                   // Source role
              "enabled": false,                           // Role status
              "par_slice": "False"                        // Expression stating which function parameter(s) to slice
            },
            "sink": {                                     // Sink role
              "enabled": true,                            // Role status
              "par_slice": "i == 1"                       // Expression stating which function parameter(s) to slice
            },
            "fixer": {                                    // Fixer role
              "enabled": false                            // Role status
            }
          }
        }
      }
    }
  }
}
The par_slice expression (see grammar) specifies which function parameters should be included in the backward slice. The selection of parameters depends on your specific use case and analysis goals. For example, when trying to identify potential vulnerabilities, you should slice parameters of source functions that introduce untrusted input, as well as parameters of sink functions that could result in dangerous behavior. It is relevant to slice source function parameters because the backward slice from a sink might not always reach the source's call site directly - it may instead trace back to where the parameter is defined.
Configure Functions via Binary Ninja UI
In addition to defining functions via JSON files, Mole allows users to define them directly from Binary Ninja's UI. By right-clicking a call instruction (or function) and selecting the appropriate option from the context menu, users can configure the function interactively.

For call instructions, users can choose to target either a specific call site or all detected call sites. This distinction is only relevant when performing manual slicing without explicitly adding the function to the taint model (using the Find button in the dialog below).
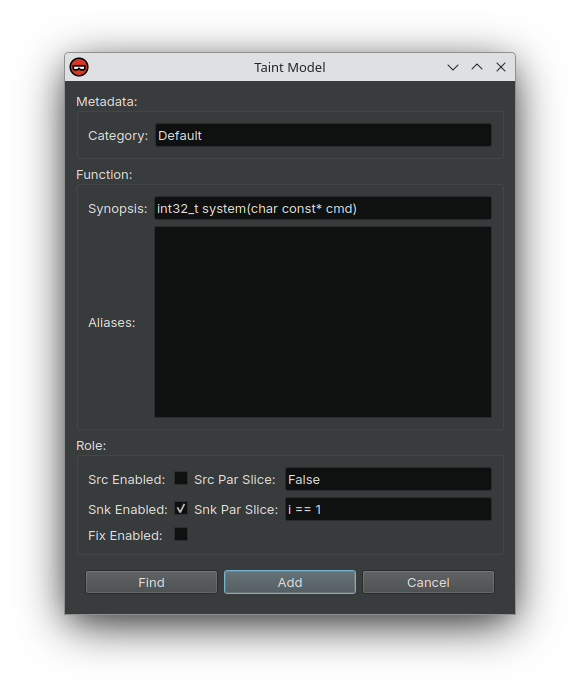
The configuration options are identical to those described above for the JSON files.
Clicking the Find button starts the slicing process without modifying the taint model. If the configured function is marked as a source, Mole treats it as the sole source and searches for paths to any sinks enabled in the taint model. Conversely, if the function is marked as a sink, Mole performs a backward slice from that sink toward all sources defined in the taint model.
Clicking the Add button registers the configured function in the taint model under a dedicated library named manual.
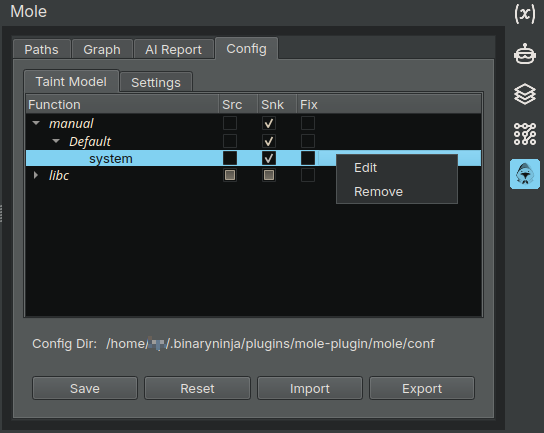
A function can later be edited by double-clicking its name or by right-clicking it and selecting Edit from the appearing context menu. The context menu also provides an option to Remove selected functions.
Clicking the Save button stores the current configuration and writes it to the file conf/000-mole.json (see the table above). The saved settings are also used when Mole runs in headless mode, unless a different configuration file is specified with the --config_file command-line argument. The Reset button restores all configuration options to their default values. The Export and Import buttons allow you to export or import the current configuration. For example, you may export a specific configuration as a backup or reuse it when running Mole in headless mode.
Settings
This section provides an overview of the settings available in Mole.
General
| Setting | Description |
|---|---|
| max_workers | Maximum number of worker threads that backward slicing uses |
| max_call_level | Backward slicing visits called functions up to the given level |
| max_slice_depth | Maximum slice depth to stop the search |
| max_memory_slice_depth | Maximum memory slice depth to stop the search |
| src_highlight_color | Color used to highlight instructions originating from slicing a source function |
| snk_highlight_color | Color used to highlight instructions originating from slicing a sink function |
| path_grouping | Strategy used to group paths |
OpenAI API Endpoint
Mole includes an AI-assisted analysis mode designed to provide deeper insights into identified paths. This feature leverages Large Language Models (LLMs) to examine potential vulnerabilities, evaluate their severity, and suggest inputs that could trigger the corresponding code paths.
To enable AI-based analysis, you must first configure an OpenAI-compatible endpoint in the Config / Settings sub-tab. The following settings are available:
| Setting | Description |
|---|---|
| base_url | URL of OpenAI-compatible API endpoint (e.g., https://api.openai.com/v1) |
| api_key | API key for authentication (leave empty for MOCK mode) |
| model | Model to use (e.g., o4-mini) |
| max_turns | Maximum number of turns in a conversation |
| max_completion_tokens | Maximum number of tokens in a completion |
| temperature | Sampling temperature (lower values make the output more focused and deterministic) |
Based on our initial testing, OpenAI's o4-mini model offers a good balance between output quality and cost efficiency. However, you are free to use any model or provider that supports tool calling and structured output, depending on your preferences and requirements.
Cost Disclaimer: The AI analysis feature may incur charges from your LLM provider, depending on their API pricing. Costs can vary based on the selected model, the complexity and length of each analysis, and the number of paths analyzed. Be sure to review your provider's pricing structure before running bulk analyses.
Privacy Disclaimer: When using the AI analysis feature, information from the current binary - such as code, symbols, strings, comments, and other contextual data - may be sent to the configured OpenAI-compatible endpoint for processing. Do not use this feature on binaries containing sensitive, proprietary, or confidential information, as the data may be transmitted to a third party. Use this functionality at your own discretion and in accordance with your organization's security policies.
Headless Mode
Use Mole with the -h flag to display detailed usage information. The example below demonstrates how to run Mole on one of the unit tests (make sure to build them first by running cd tests/data/ && make):
mole bin/memcpy-01 > ./memcpy-01.log 2>&1
Example
Inspecting Paths
Below is an example log output as given by Mole. The listed path is identified on unit test memcpy-01.c, when compiled for linux-x86_64. At log level INFO, the following output is given:
[...]
Interesting path: 0x401145 memcpy(arg#3:rdx#1) <-- 0x401119 getenv [L:12,P:0,B:1]!
[...]
This entry highlights a potential data flow from the source function getenv (at 0x401119) to the sink function memcpy (at 0x401145). Specifically, data returned by getenv influences the 3rd parameter of memcpy (synopsis: void* memcpy(void* dest, const void* src, size_t n)), which determines the number of bytes to copy.
The annotation [L:12,P:0,B:1] provides additional insights:
L:12indicates the path spans 12 MLIL instructionsP:0means no PHI instructions are involvedB:1shows that the path depends on a single branch condition
These metrics offer a rough estimate of the path's complexity, which can help assess the likelihood of it being a true positive.
At log level DEBUG, a full listing of the instructions along the path is shown, starting from the sink (backward slicing):
[...]
--- Backward Slice  ---
- FUN: 'main', BB: 0x401123
0x401145 mem#5 = memcpy(rdi_1#3, rsi#1, rdx#1) @ mem#4 (MediumLevelILCallSsa)
0x401145 rdx#1 (MediumLevelILVarSsa)
0x401142 rdx#1 = rbx_1#1 (MediumLevelILSetVarSsa)
0x401142 rbx_1#1 (MediumLevelILVarSsa)
0x40113f rbx_1#1 = sx.q(rax_1#5) (MediumLevelILSetVarSsa)
0x40113f sx.q(rax_1#5) (MediumLevelILSx)
0x40113f rax_1#5 (MediumLevelILVarSsa)
0x401132 rax_1#5, mem#4 = strtol(rdi#2, nullptr, 0xa) @ mem#2 (MediumLevelILCallSsa)
0x401132 rdi#2 (MediumLevelILVarSsa)
0x401123 rdi#2 = nptr#2 (MediumLevelILSetVarSsa)
0x401123 nptr#2 (MediumLevelILVarSsa)
- FUN: 'main', BB: 0x4010f2
0x401119 nptr#2, mem#2 = getenv("MEMCPY_SIZE") @ mem#1 (MediumLevelILCallSsa)
-----------------------
[...]
Instructions are grouped by function (FUN) and basic block (BB). For instance, instructions 1-11 belong to the basic block starting at address 0x401123 within the main function, while instruction 12 belongs to the basic block at 0x4010f2, also within main. This grouping is particularly useful for following the path in Binary Ninja's graph view.
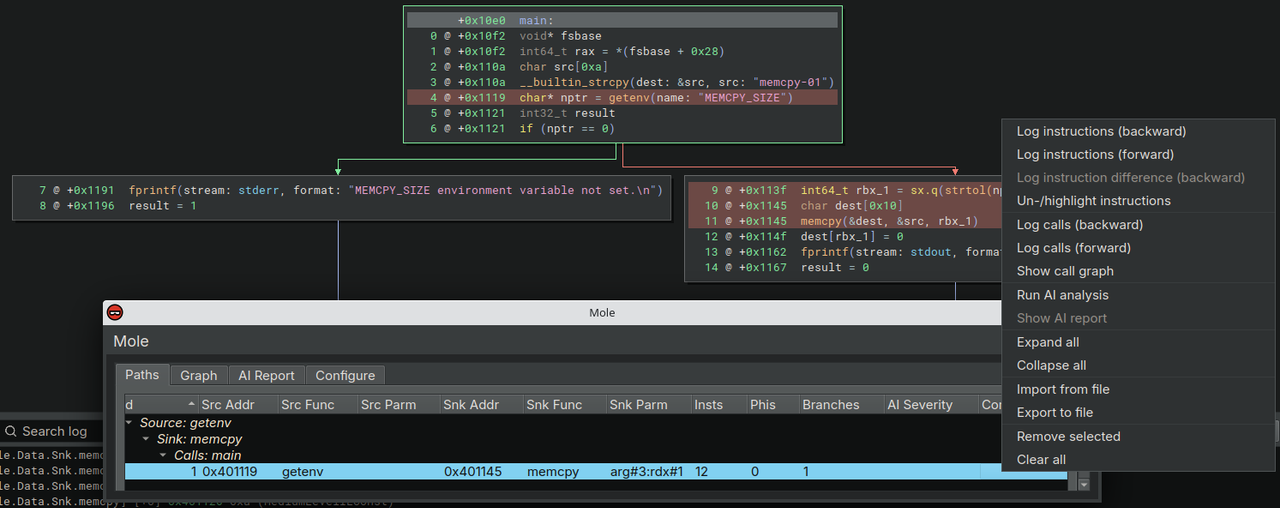
Beyond the textual log output, Mole also summarizes identified paths in the Paths tab when used within Binary Ninja's UI. Right-clicking on a path opens a context menu with several actions such as:
- Viewing detailed path information
- Highlighting instructions in the path
- Visualizing the involved calls as graph
- Analyzing a path with AI
These features help users better inspect and validate identified paths during analysis.
Visualizing Paths As Call Graphs
Right-clicking a path opens Mole's context menu, and selecting Show call graph visualizes the functions involved in that path as a graph.
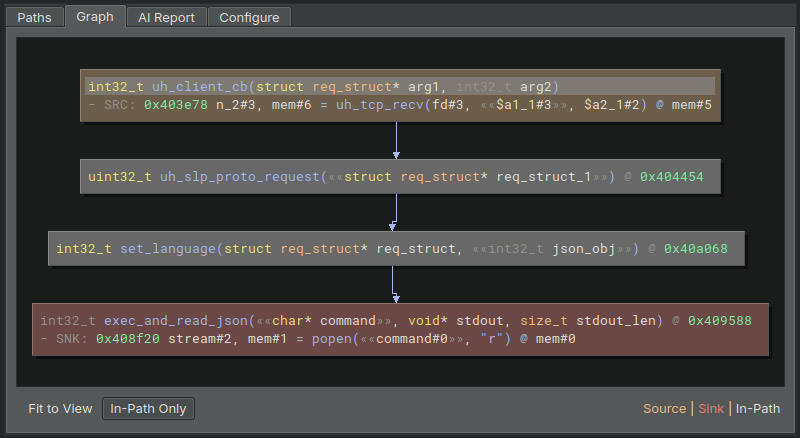
The graph above for instance illustrates the following:
- The path's source (SRC) is the
uh_tcp_recvcall instruction at address0x403e78. The path-relevant parameter ofuh_tcp_recvis««$a1_1#3»». - The source instruction is part of the function
uh_client_cb. uh_client_cbcallsuh_slp_proto_request(call site at0x404454), with the path-relevant parameter««struct req_struct* req_struct_1»».uh_slp_proto_requestcallsset_language(call site at0x40a068), with the path-relevant parameter««int32_t json_obj»».set_languagecallsexec_and_read_json(call site at0x409588), with the path-relevant parameter««char* command»».exec_and_read_jsoncontains the path's sink (SNK), namely the call topopenat address0x408f20. The path-relevant parameter ofpopenis««command#0»».
Note: Parameters and return values relevant to the analyzed path are highlighted using the ««var»» notation.
In summary, the graph shows that a JSON object received over TCP may eventually be passed as a command string to popen within the set_language functionality. The graph therefore provides a rapid and effective way to pinpoint the nature of the potential underlying vulnerability.
Analyzing Paths With AI
Once configured, you can initiate AI analysis by right-clicking on any path (or a group of selected paths) in the Paths tab and choosing Start AI analysis from the context menu.
The analysis may take some time, depending on the complexity of the paths and the model in use. Once complete, an AI-generated severity level will appear in the path tree view.
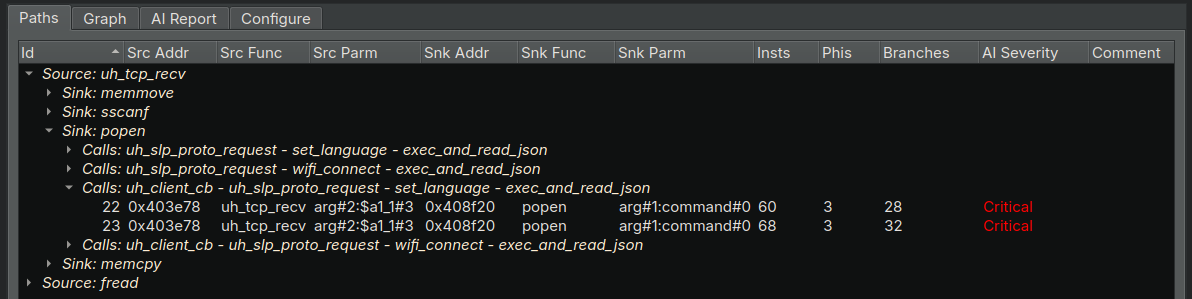
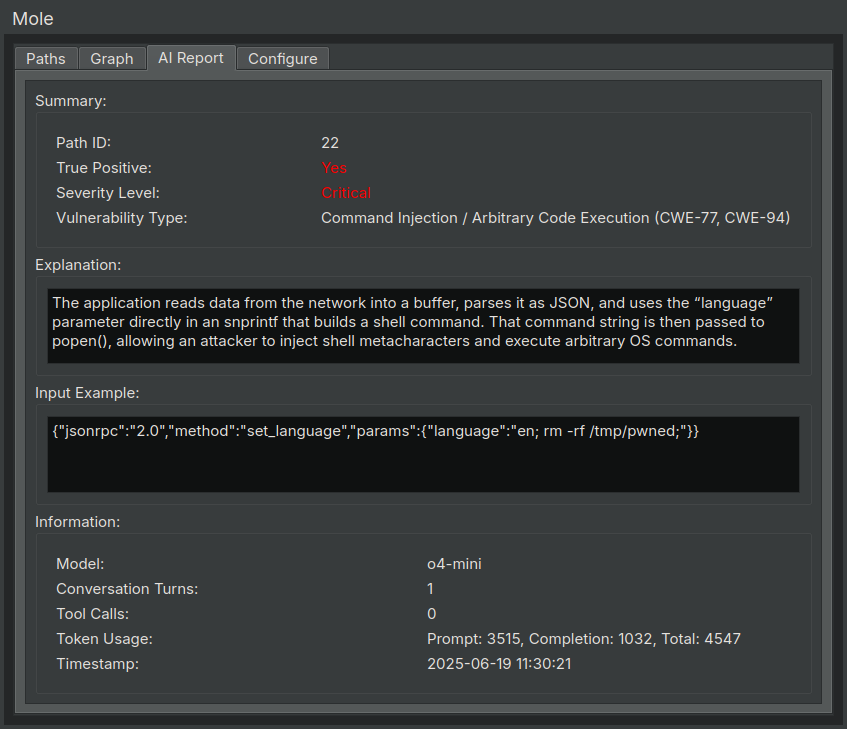
For more detailed insights, right-click on a path and select Show AI report from the context menu (or double-click on the path's severity level). The report includes the following information:
- True positive status
- Severity level (Low, Medium, High, Critical)
- Vulnerability type
- Explanation of the issue
- Example of a potential triggering input
- Additional context from the AI analysis